Aviation Weather
General Aviation's   Weather Center,   including   Airport   and   Pilot Information

Home  


Page Table of Contents

Airport Information and Weather

Altitude  Inches-Millibars-Feet Table

Convective Sigmets

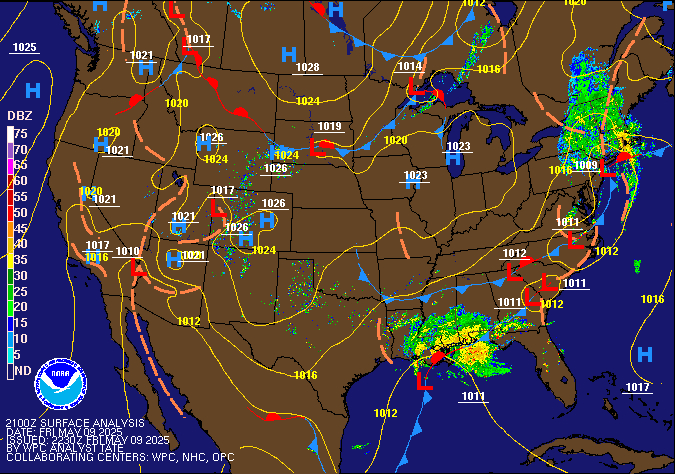
Current US Weather

Density Altitude

Dew Point

High-Resolution Rapid Refresh

Icing Levels

Links to Related Websites

NOAA Advisory Chart

Radar

Relative Humidity

Sky Cover

Surface Winds

Temperature

Turbulence

Winds at 3,000 6,000 9,000


Click on a chart to see the full website.

Links to Related Websites

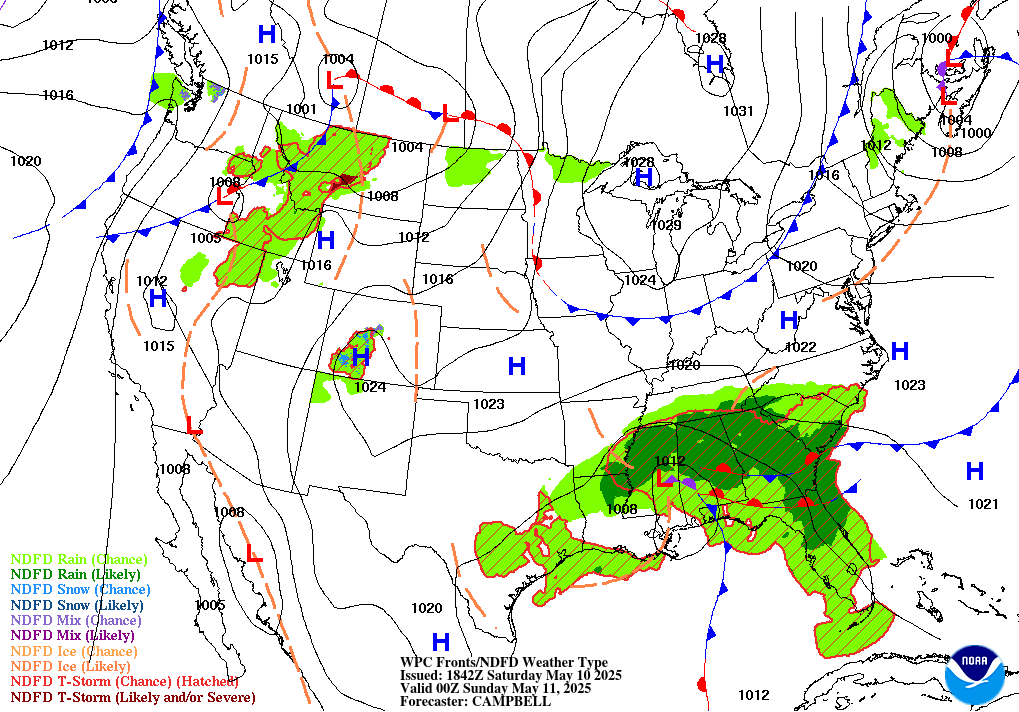
National Weather Service weather charts

NOAA Links:
    Aviation Weather
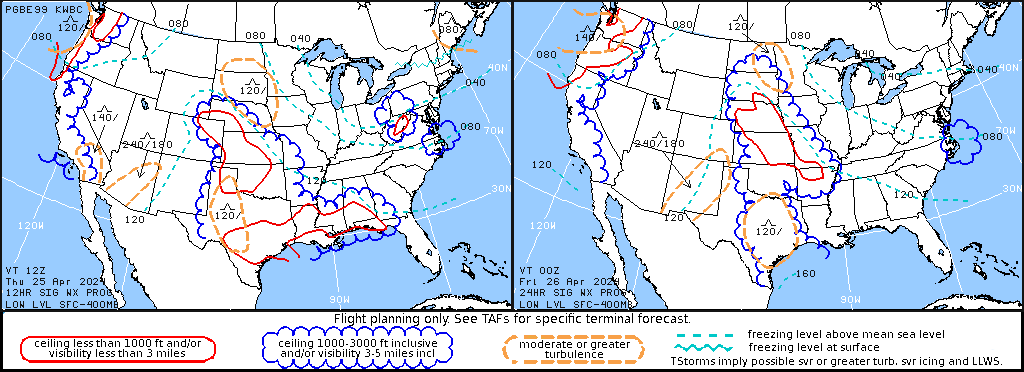
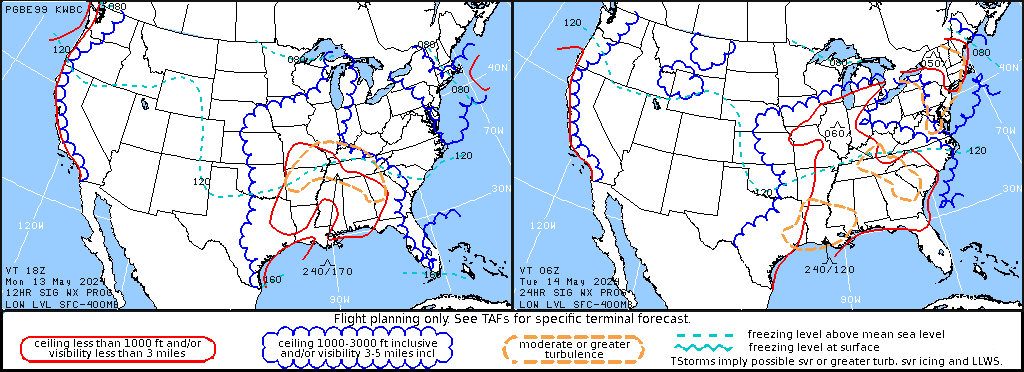
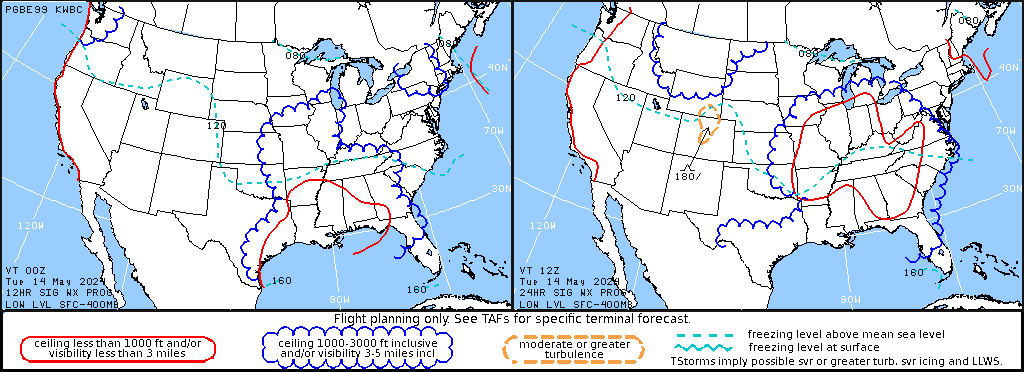
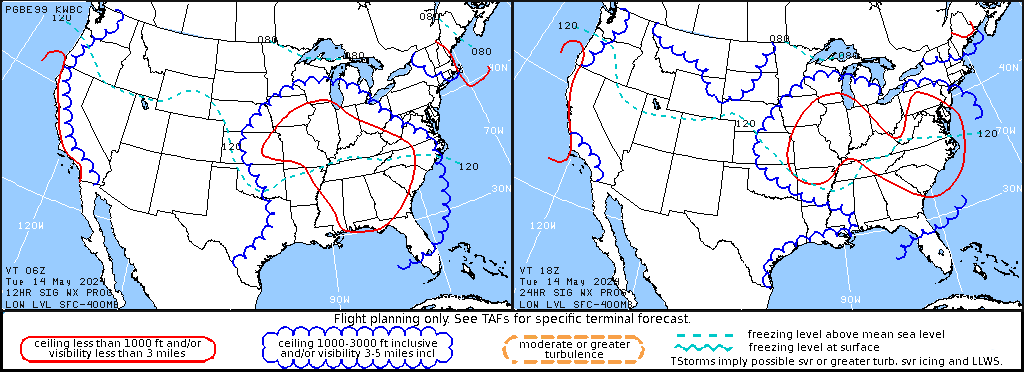
    Ceilings and Visibility
    Icing
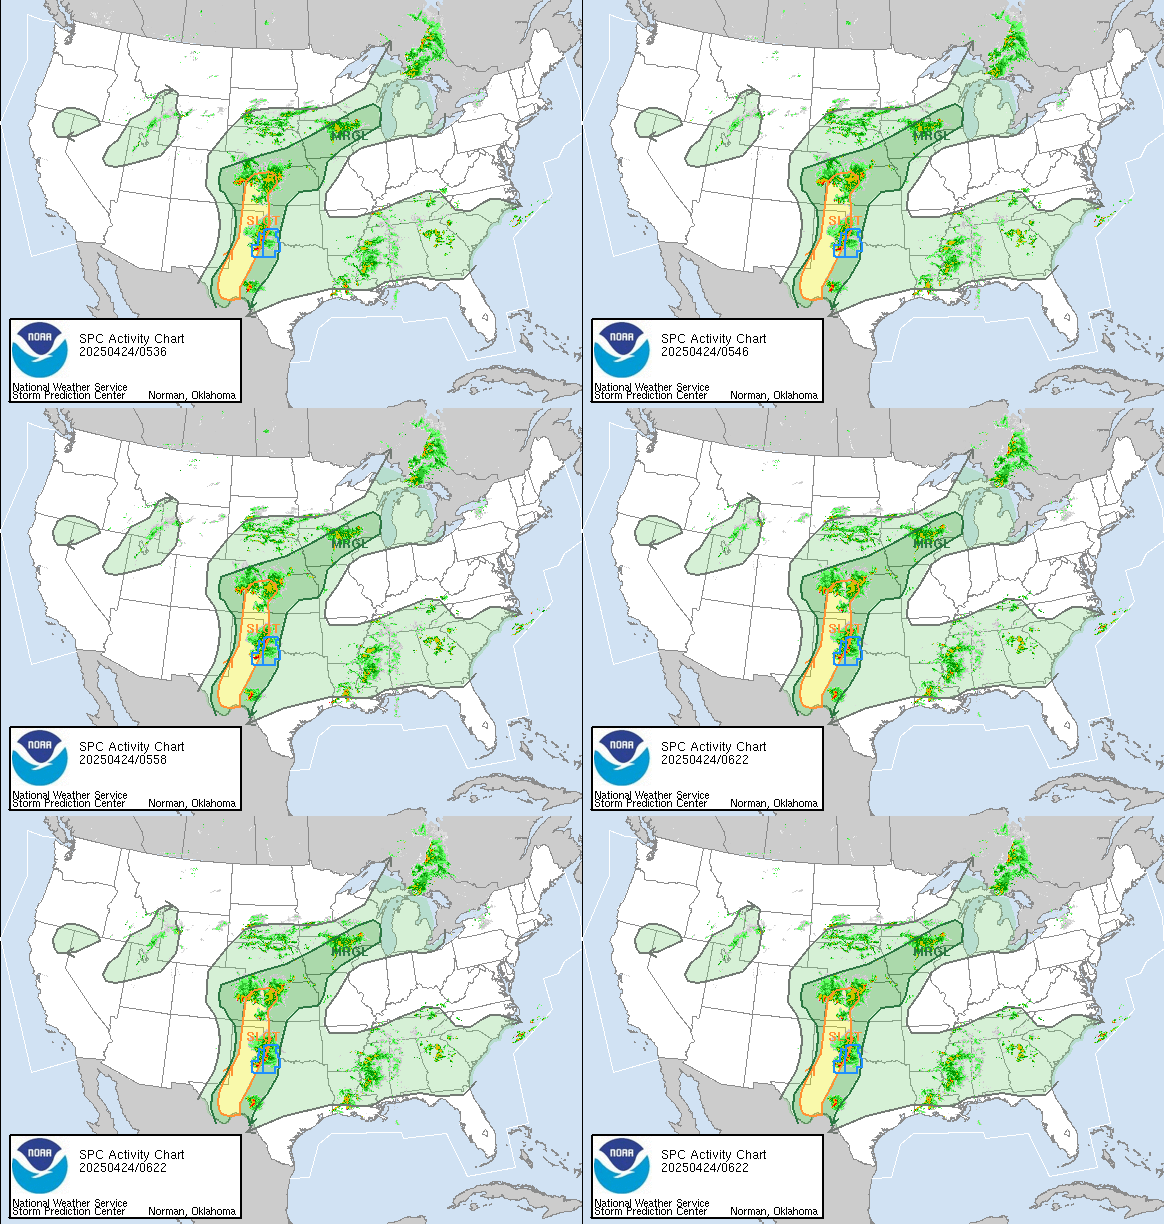
    Storm Prediction Center
        (see Categorical Outlook at left for expected activity)
    METARs and TAFs
    General Information: GOES Atmospheric Soundings Display
        Click here for a good description of Skew-T-graphic plotting.


METARs, TAFs, and MOSs will tell you the cloud bases.

But where are the cloud tops?  Knowing both would tell you how bumpy the clouds are, and what level of turbulence to expect.

Skew-T Log-P diagrams will tell you that.

For more information, visit our webpage on Skew-T Log-P Charts.


From NASA:  New technology for detecting turbulence
Canadian Weather Links:
    Canadian Aviation Weather
    Canadian Surface Analysis Charts

Four Major Weather Forecasting Models
    European Center for Medium-Range Weather Forecasts (ECMWF)
    NOAA Global Forecast System (GFS)
    NOAA High Resolution Rapid Refresh (HRRR)
    NOAA North American Mesoscale (NAM)

FAA Links:
    1-800-WxBrief — Weather Briefing
    AC 00-6B - Aviation Weather
    Aircraft Registry
    ASOS, AWOS Ground Weather Observation Stations
    Flight Plan Filing, other pilot info
    FNS NOTAM Search
    FSDO - Columbia, SC
    General Aviation & Recreational Aircraft
    Online Resources for Pilots
    Pilot's Guide To Preflight Weather Planning
    Runway Safety Videos
    Special Use Airspace (SUA) Alerts
    TFRs
Inches Hg   to   Millibars   to   Altitude   conversion   (standard pressure)
29.92" = 1013 mb = 0000'       23.98" = 0812 mb = 6000'       14.76" = 0500 mb = FL 180
28.85" = 0977 mb = 1000' 23.09" = 0782 mb = 7000' 11.81" = 0400 mb = FL 240
27.82" = 0942 mb = 2000' 22.24" = 0753 mb = 8000' 8.86" = 0300 mb = FL 300
26.81" = 0908 mb = 3000' 21.38" = 0724 mb = 9000' 6.64" = 0225 mb = FL 360
25.84" = 0875 mb = 4000' 20.58" = 0697 mb = 10,000' 5.17" = 0175 mb = FL 420
24.89" = 0843 mb = 5000' 19.19" = 0650 mb = 12,000' 3.69" = 0125 mb = FL 480

Airport Information and Weather

 
Links provided to AirNav.com, FlightAware, and the NOAA Aviation Weather Center.   See also the Visibility and Airport Conditions national chart

For weather information for an airport not listed, see FlightAware.com.

For information on an airport not listed, see AirNav.com/airport.
See also weather information from the National Weather Service.

If there is an airport you would like to see listed, email your request.
 
Alabama   Connecticut   Florida    
HSV Huntsville METAR TAF DXR Danbury METAR TAF ISM Kissimmee METAR TAF  
 
Georgia    
PDK Atlanta METAR TAF PDK Safety Information, Video TOC Toccoa METAR TAF
 
Illinois   Indiana  
IKK Kankankee METAR TAF PIA Peoria METAR TAF UIN Quincy METAR TAF HUF Terre Haute METAR TAF
 
Iowa   Maine   Mississippi   New York  
DEH Decorah METAR TAF PWM Portland METAR TAF MEI Meridian METAR TAF ALB Albany METAR TAF
 
North Carolina  
GSO Greensboro METAR TAF HKY Hickory METAR TAF RDU Raleigh-Durham METAR TAF RUQ Salisbury METAR TAF
 
Pennsylvania  
CXY Harrisburg METAR TAF RDG Reading METAR TAF AVP Wilkes-Barre METAR TAF UNV University Park METAR TAF
 
Quebec, Canadaa    
CYHU Montreal METAR TAF  
 
South Carolina  
AIK Aiken METAR TAF
AQX Allendale METAR TAF
AND Anderson METAR TAF
BNL Barnwell METAR TAF
ARW Beaufort METAR TAF
BBP Bennettsville METAR TAF
52J Bishopvilleville METAR TAF
SC55 Broxton Bridge METAR TAF
CDN Camden METAR TAF
CHS Charleston METAR TAF
CQW Cheraw METAR TAF
DCM Chester METAR TAF
CAE Columbia Metro METAR TAF
CUB Columbia Owens METAR TAF
HYW Conway METAR TAF
UDG Darlington METAR TAF
FLO Florence METAR TAF
GGE Georgetown METAR TAF
GYH Greenville Donaldson METAR TAF
GMU Greenville Municipal METAR TAF
        GMU Safety Information, Video
GRD Greenwood METAR TAF
GSP Greer METAR TAF
HVS Harstville METAR TAF
HXD Hilton Head METAR TAF
5J5 Holly Hill METAR TAF
LUX Laurens METAR TAF
MKS Moncks Corner METAR TAF
LRO Mt. Pleasant METAR TAF
MYR Myrtle Beach METAR TAF
EOE Newberry METAR TAF
CRE North Myrtle Beach METAR TAF
CEU Oconee METAR TAF
OGB Orangeburg METAR TAF
SC41 Palmetto Air METAR TAF
6J0 Pelion METAR TAF
LQK Pickens METAR TAF
3J1 Ridgeland METAR TAF
UZA Rock Hill METAR TAF
SPA Spartanburg METAR TAF
SMS Sumter METAR TAF
SC00 Triple Tree METAR TAF
RBW Walterboro METAR TAF
SC99 White Plains METAR TAF
FDW Winnsboro METAR TAF
 
South Dakota   Texas   Tennessee  
RAP Rapid City METAR TAF SAT San Antonio METAR TAF BNA Nashville METAR TAF GKT Sevierville METAR TAF
 
Virginia    
ROA Roanoke METAR TAF SHD Shenandoah METAR TAF JGG Williamsburg METAR TAF  
 

NOAA Current US Weather

NOAA chart not currently available

High-Resolution Rapid Refresh (HRRR)

HRRR chart not currently available

Convective Sigmets


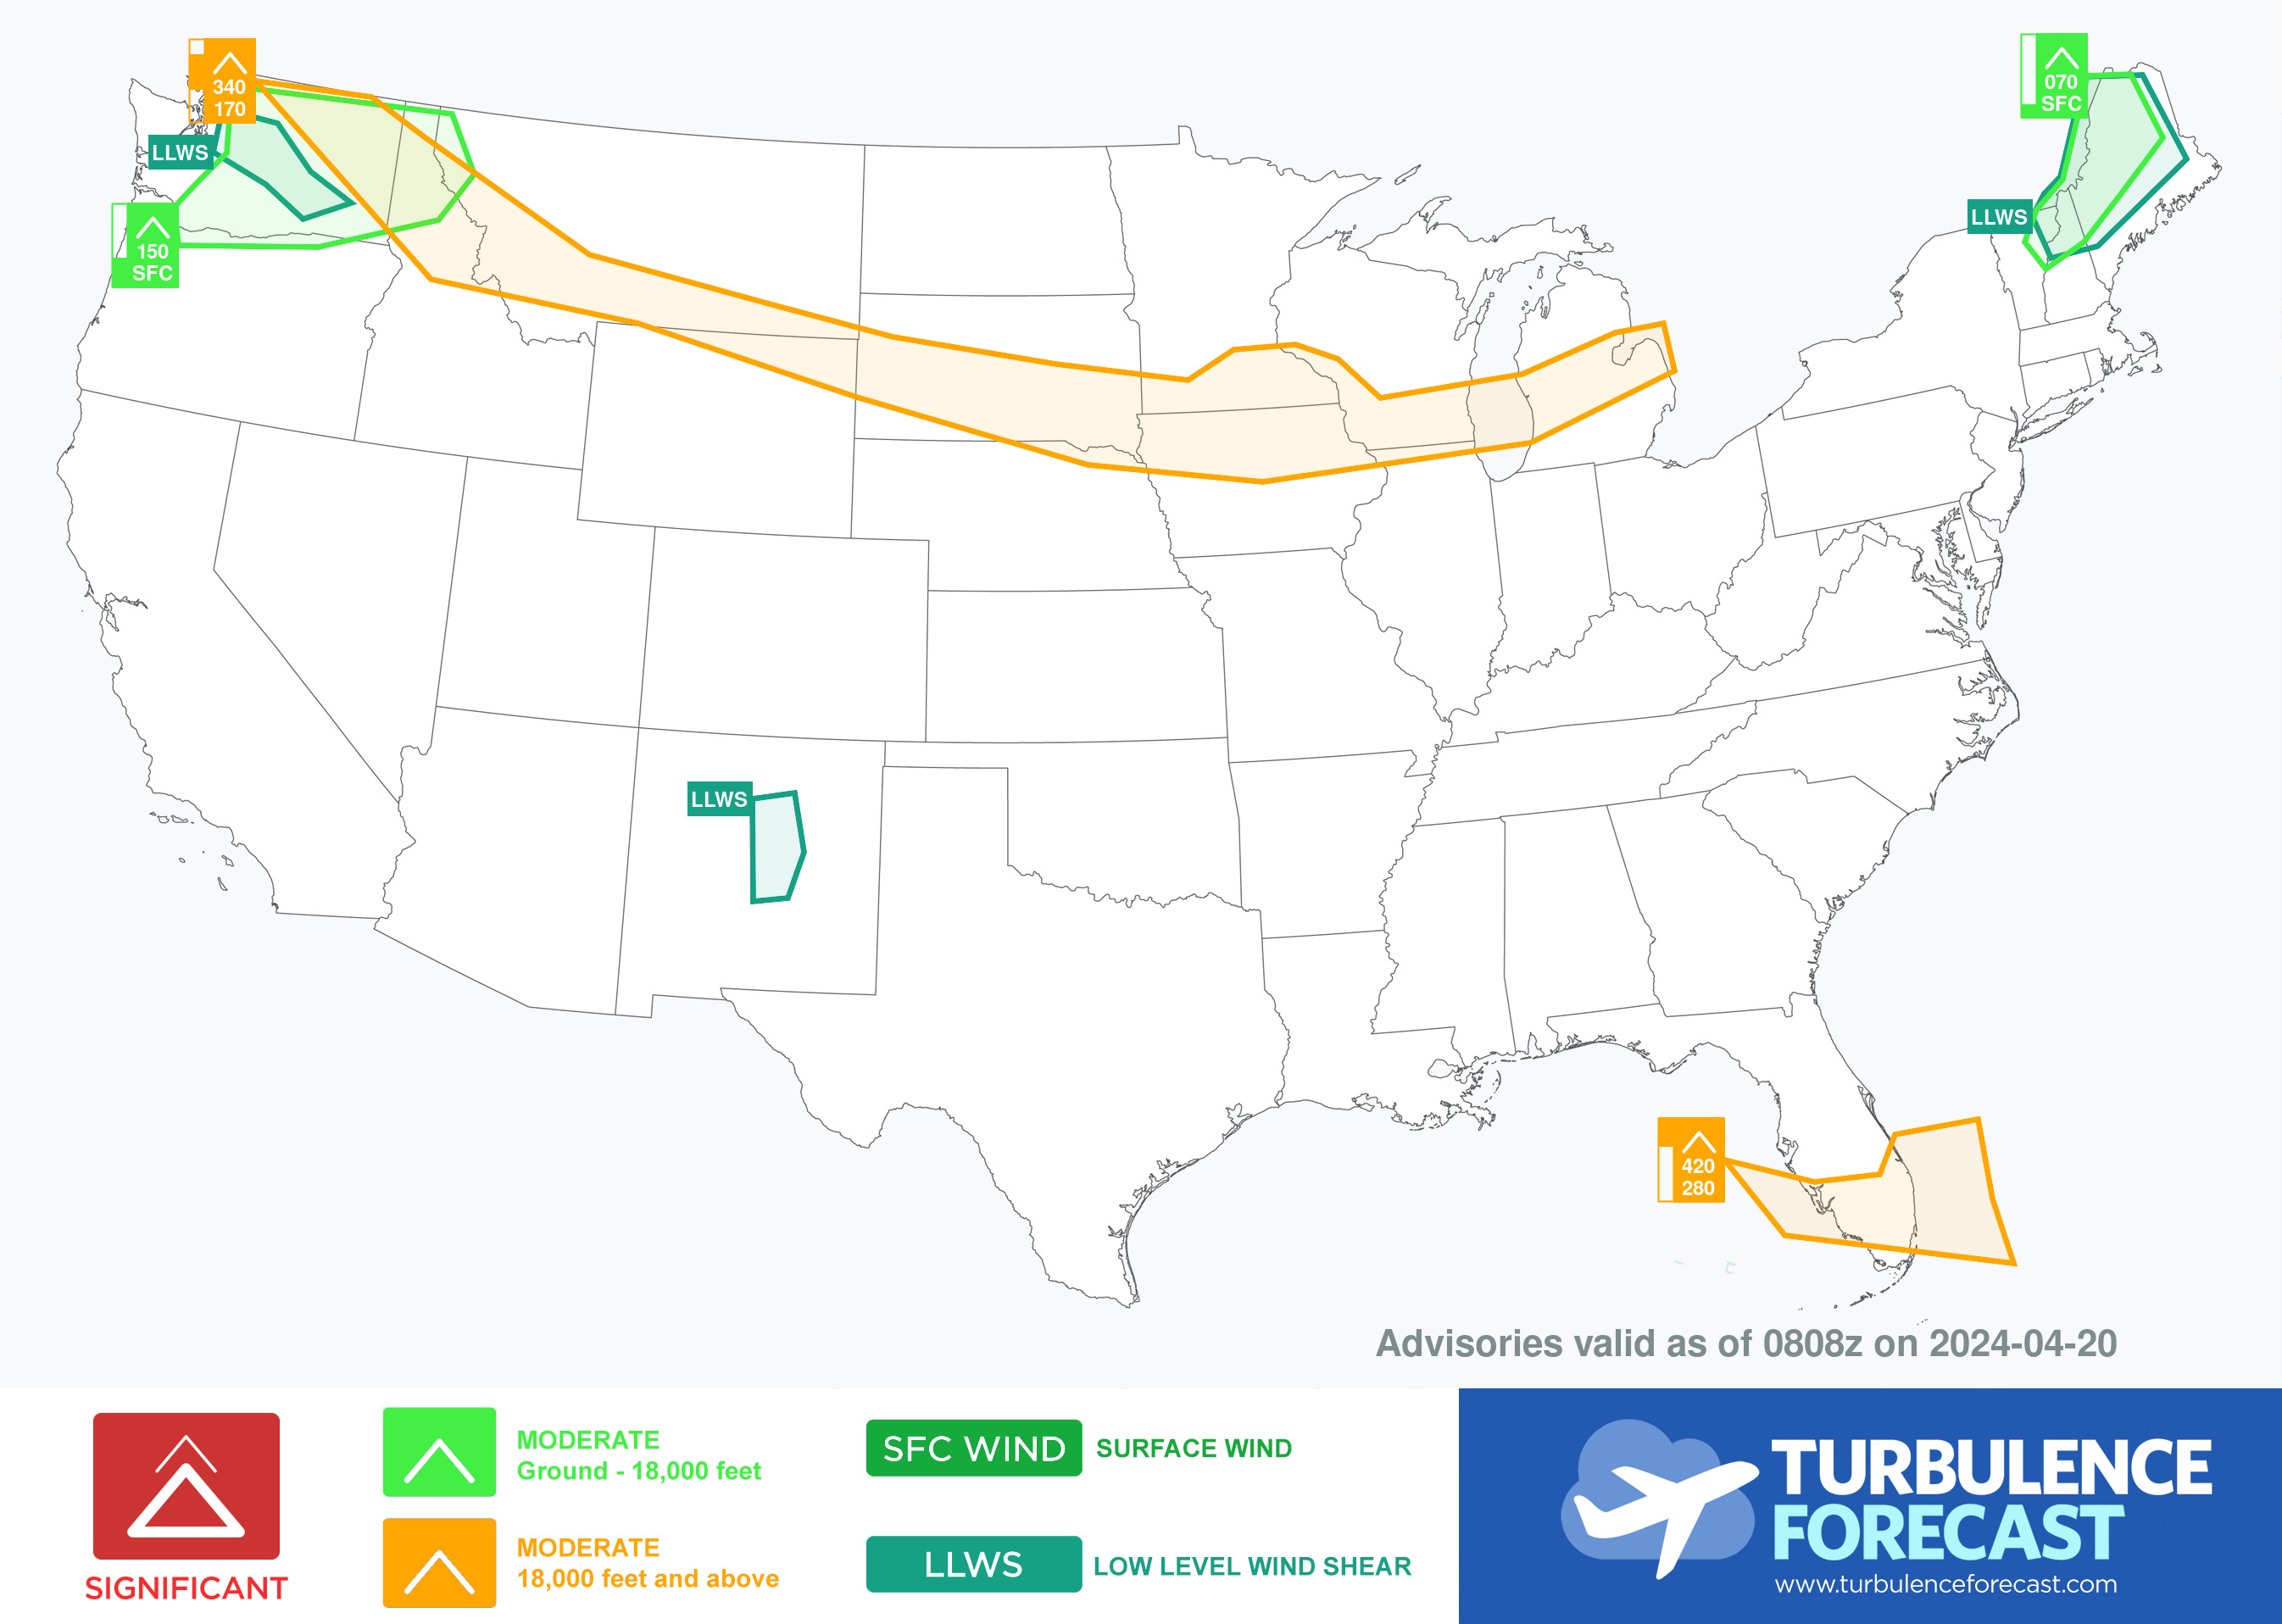
Turbulence

Levels of Turbulence

Light – Small, correctable deviations from position and altitude.  Aircraft control is maintained.

Moderate – Significant deviations from position and altitude.  Momentary losses of control of aircraft.

Severe – Uncontrollable deviations from position and altitude.  Loss of control of aircraft; possible deformation and destruction of aircraft.


From NASA:  New technology for detecting turbulence

In aviation, the Richardson number is used as a rough measure of expected air turbulence. A lower value indicates a higher degree of turbulence.
Values in the range 10 to 0.1 are typical, with values below unity indicating significant turbulence.
- from https://en.wikipedia.org/wiki/Richardson_number

Surface Winds

For a detailed description of Wind Barbs, click here.
 
For information on global wind patterns, click here.

Winds at 3,000 6,000 9,000 Feet

For a detailed description of Wind Barbs, click here.
 
For information on global wind patterns, click here.


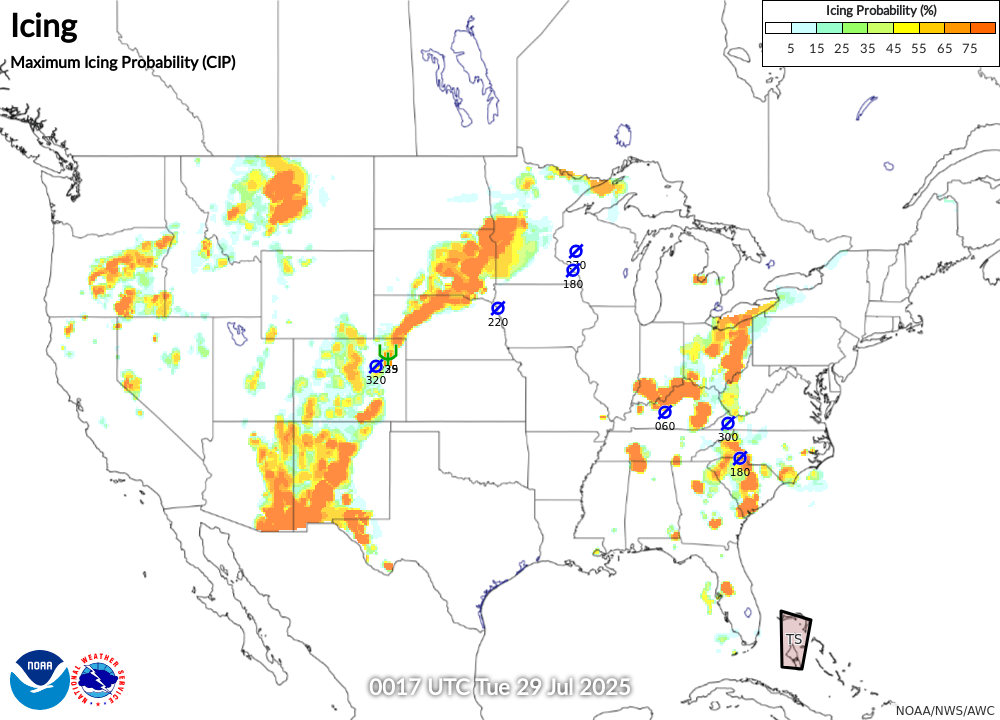
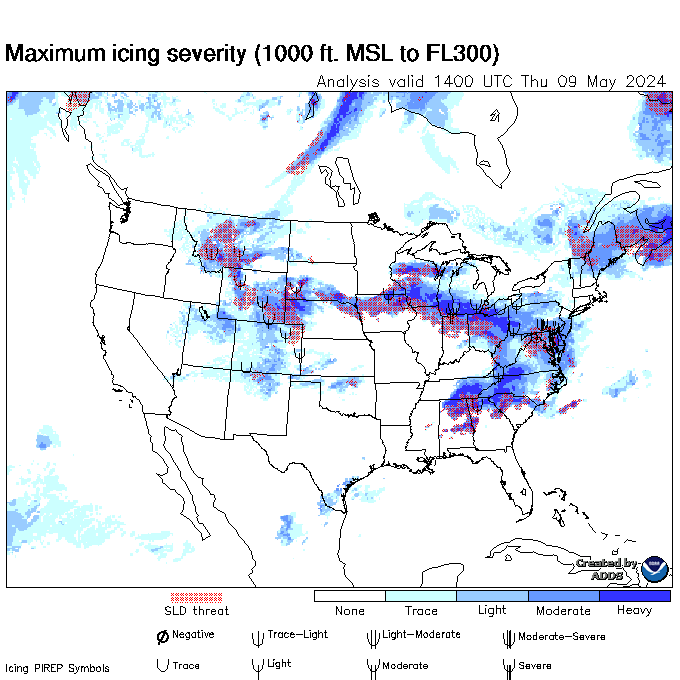
Icing Levels


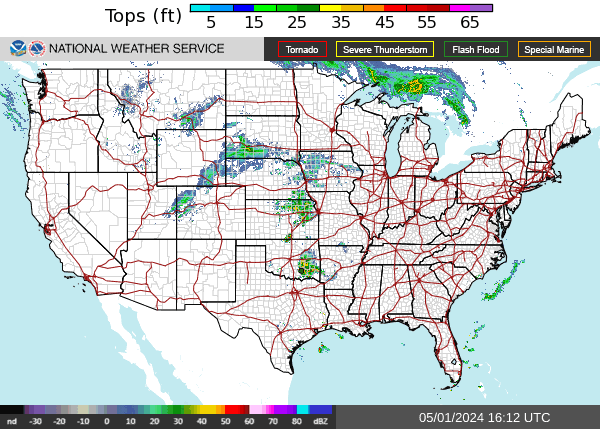
Radar


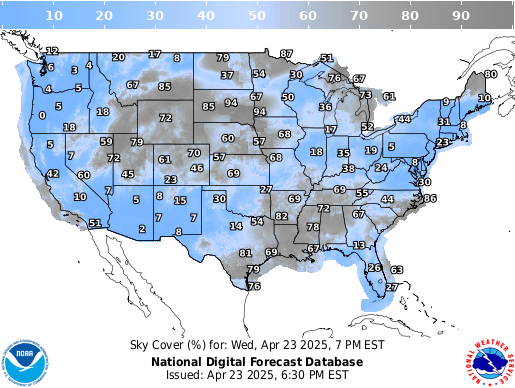
Sky Cover

Temperatures

Dew Point

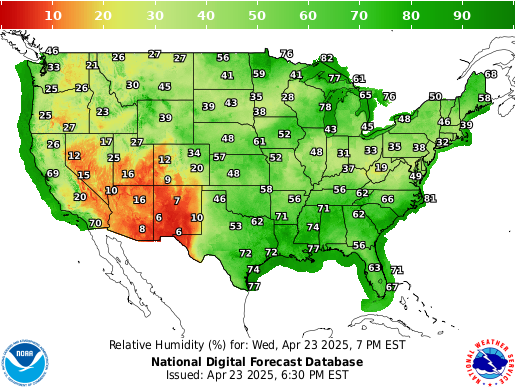
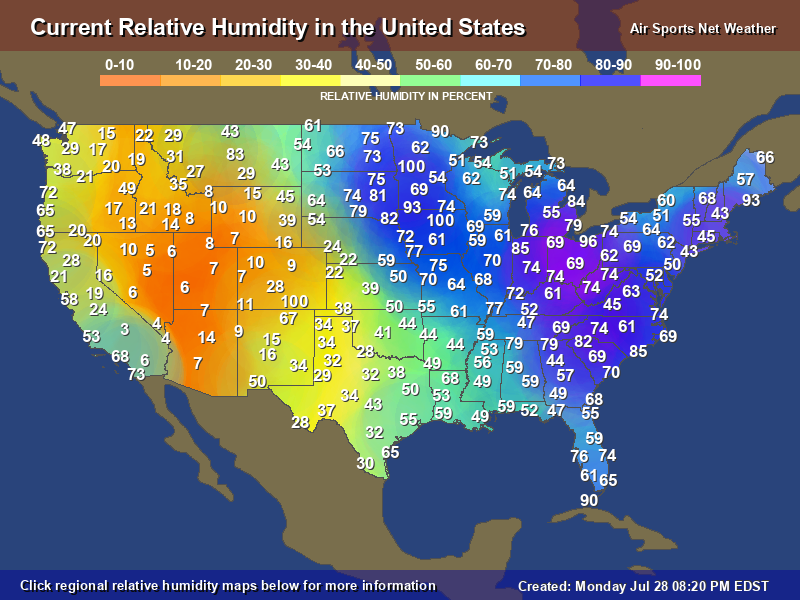
Relative Humidity

weather.gov Relative Humidity chart delayed; will be available soon -

Density Altitude

graphic not found

Density Altitude Calculator

NOAA weather advisory chart

    See also our NOAA Weather Advisory Charts webpage.

Key:
    Air Quality Alert
    Beach Hazards Statement
    Blizzard Warning
    Brisk Wind Advisory
    Coastal Flood Advisory
    Coastal Flood Statement
    Coastal Flood Warning
    Coastal Flood Watch
    Dense Fog Advisory
    Excessive Heat Warning
    Fire Weather Watch
    Flash Flood Warning
    Flood Advisory
    Flood Warning
    Flood Watch
    Freeze Warning
    Freeze Watch
    Freezing Spray Advisory
    Frost Advisory
    Gale Warning
    Gale Watch
    Hard Freeze Warning
    Hard Freeze Watch
    Hazardous Seas Warning
    Hazardous Weather Outlook
    Heat Advisory
    Heavy Freezing Spray Warning
    High Surf Advisory
    High Wind Warning
    High Wind Watch
    Hurricane Force Wind Warning
    Hydrologic Outlook
    Lake Effect Snow Warning
    Lake Wind Advisory
    Lakeshore Flood Advisory
    Lakeshore Flood Warning
    Low Water Advisory
    Marine Weather Statement
    Red Flag Warning
    Rip Current Statement
    Severe Thunderstorm Warning
    Severe Weather Statement
    Small Craft Advisory
    Special Marine Warning
    Storm Warning
    Special Weather Statement
    Tornado Warning
    Tornado Watch
    Tropical Storm Warning
    Wind Advisory
    Wind Chill Advisory
    Wind Chill Warning
    Winter Storm Warning
    Winter Storm Watch
    Winter Weather Advisory

Let's Go Fly! - visit flying.scottcrosby.info

Go to top